100% of Shark Attack Victims Were Wet
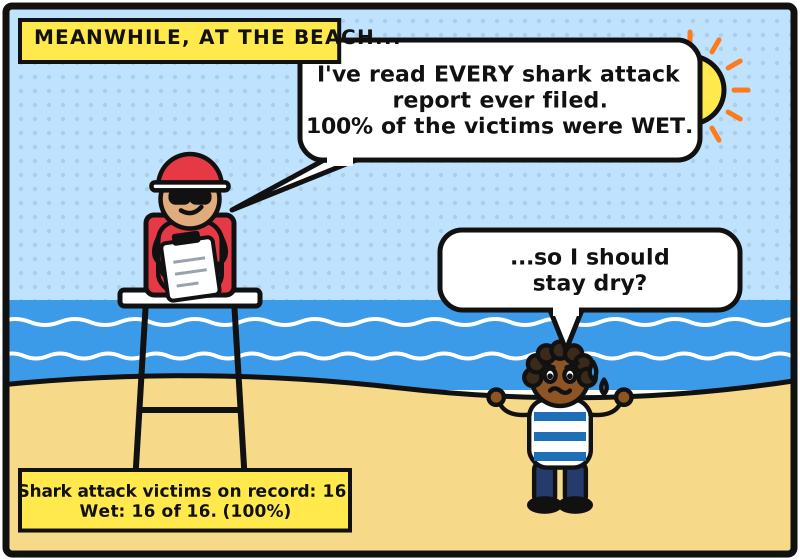
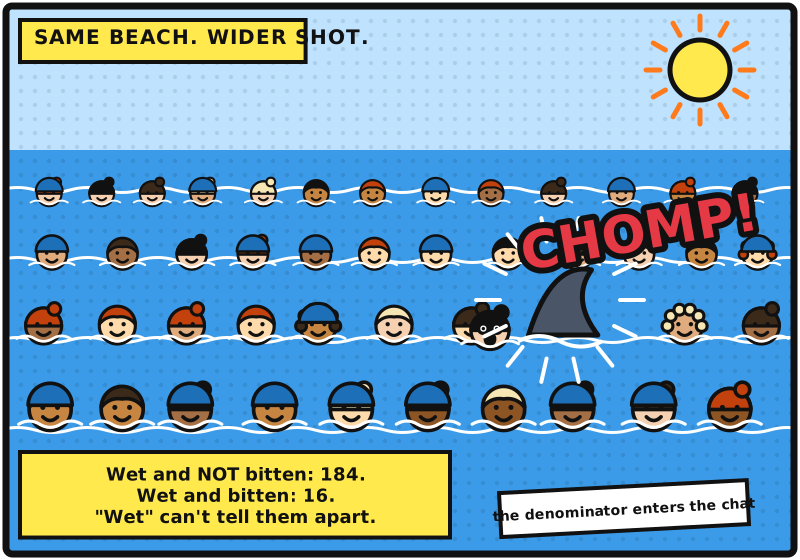
I spend a lot of my research life on a single, slightly boring point: you can’t say how much anything raises the risk of an outcome from a dataset that only contains the outcome. Every methods course teaches it early, usually under the heading “selecting on the dependent variable,” and then everyone forgets it the moment the outcome is something they care about.
So here it is with sharks instead.
The whole idea in one sentence
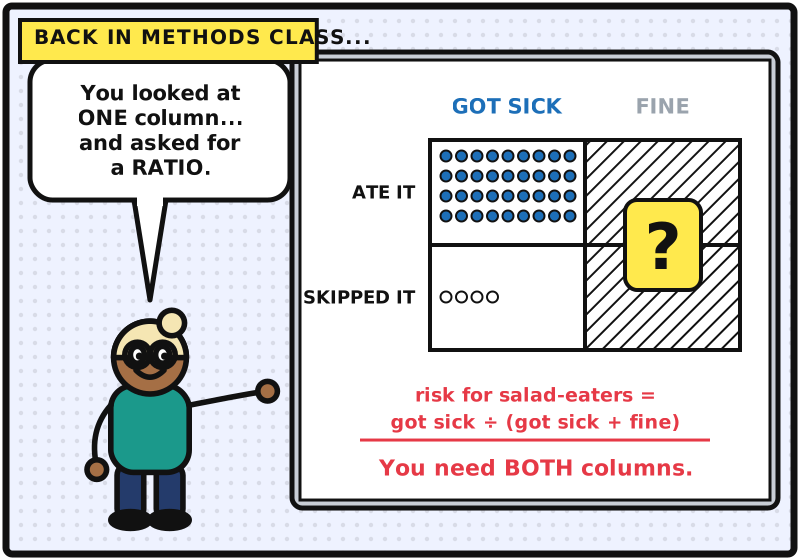
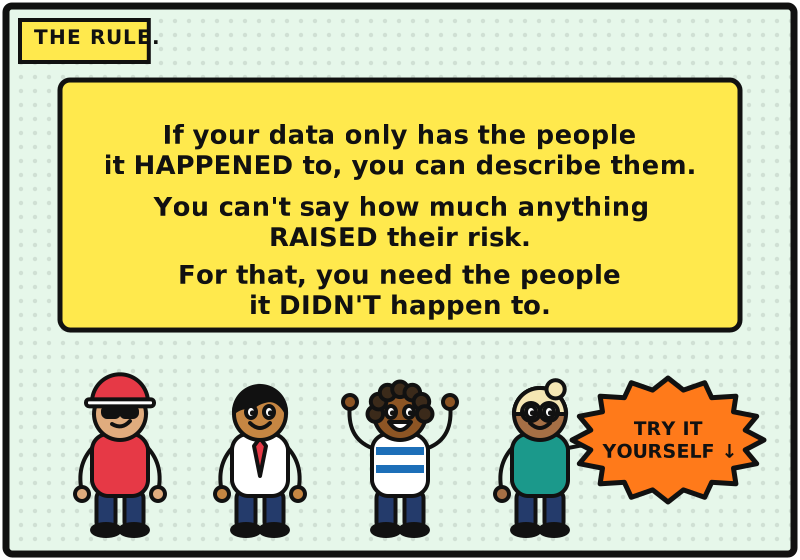
If your sample was chosen because the outcome happened, you can describe the cases. You cannot say how much anything changed the odds of the outcome. That takes the people it didn’t happen to.
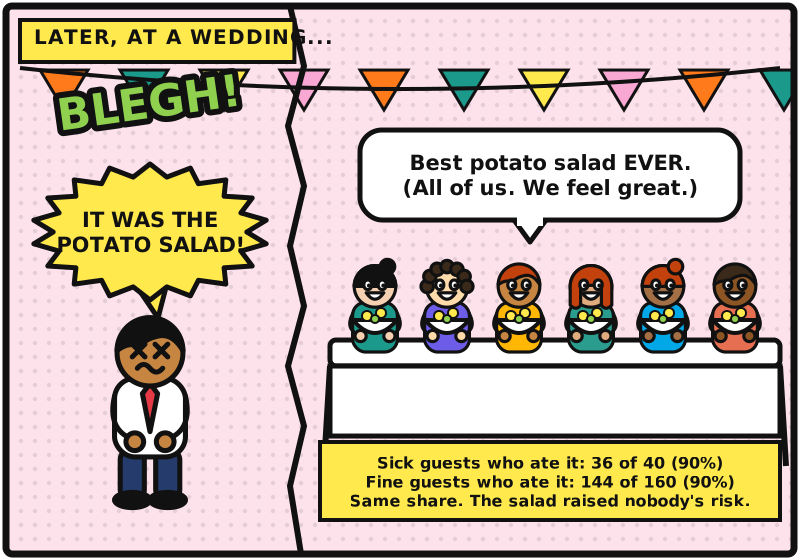
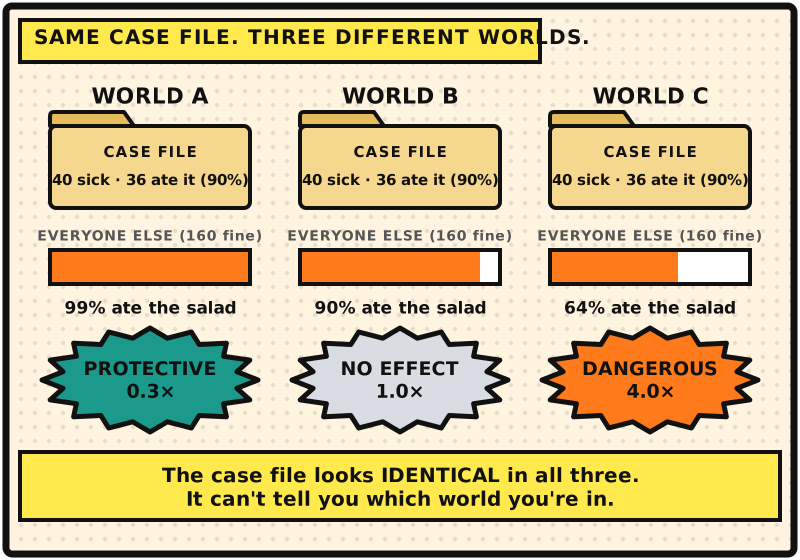
“Ninety percent of the sick guests ate the potato salad” is a real, useful fact about the sick guests. It is also completely silent about whether the salad made anyone sick, because the guests who ate it and felt fine were never interviewed. Depending on how many of them there were, the salad could have been harmless, dangerous, or (why not) protective. The case file looks identical in all three worlds.
That’s the whole trick, and it’s what the interactive version is for: a switch that reveals the people who were never in the file, and a slider that lets you move the true risk from “safe” to “yikes” while the number from the file sits there, refusing to budge.
Okay, but seriously
The reason I keep making this point is that a lot of what we know about false confessions and wrongful convictions comes from case files: exoneration databases, collections of proven false confessions, and so on. I rely on them constantly. They are often the only evidence we have about what wrongful convictions look like and what tends to appear in them.
What they can’t do is what the potato salad can’t do. “X% of exonerees falsely confessed” is a fact about the people in the file, the same way “90% of the sick guests ate the salad” is. It does not, on its own, tell you how much more likely a wrongful conviction becomes when someone confesses, or when a particular interrogation tactic is used. That number is a ratio, and the ratio needs the people who confessed, or were questioned the same way, and were not wrongfully convicted. They aren’t in the file, so we simply don’t know that number.
None of that is a criticism of the databases, or of the people who built them. It’s a statement about what a ratio is. From case file data alone, we really can’t say specifically how big or small the risk from tactic T is. If you’d like the grown-up version of this argument, with the real studies and the real numbers, the interrogation duration and false confession risk dashboards walk through what it would take to estimate the denominator for real.
My work on this problem
- Mourtgos, S. M., & Adams, I. T. (2026). Recalibrating the risk of false confession wrongful convictions: Interrogation tactics and inverse probability. Journal of Criminal Justice, 103, 102600. https://doi.org/10.1016/j.jcrimjus.2026.102600
- Mourtgos, S. M., & Adams, I. T. (2026). Interrogation duration and the estimation of false confession wrongful conviction risk: A reply to Smith and colleagues. Journal of Criminal Justice, 107, 102747. https://doi.org/10.1016/j.jcrimjus.2026.102747
- Mourtgos, S. M., & Adams, I. T. (2026). What do laboratory false confession paradigms measure? A calibration meta-analysis. Journal of Quantitative Criminology. https://doi.org/10.1007/s10940-026-09687-1
No sharks were harmed. The potato salad remains under investigation.